
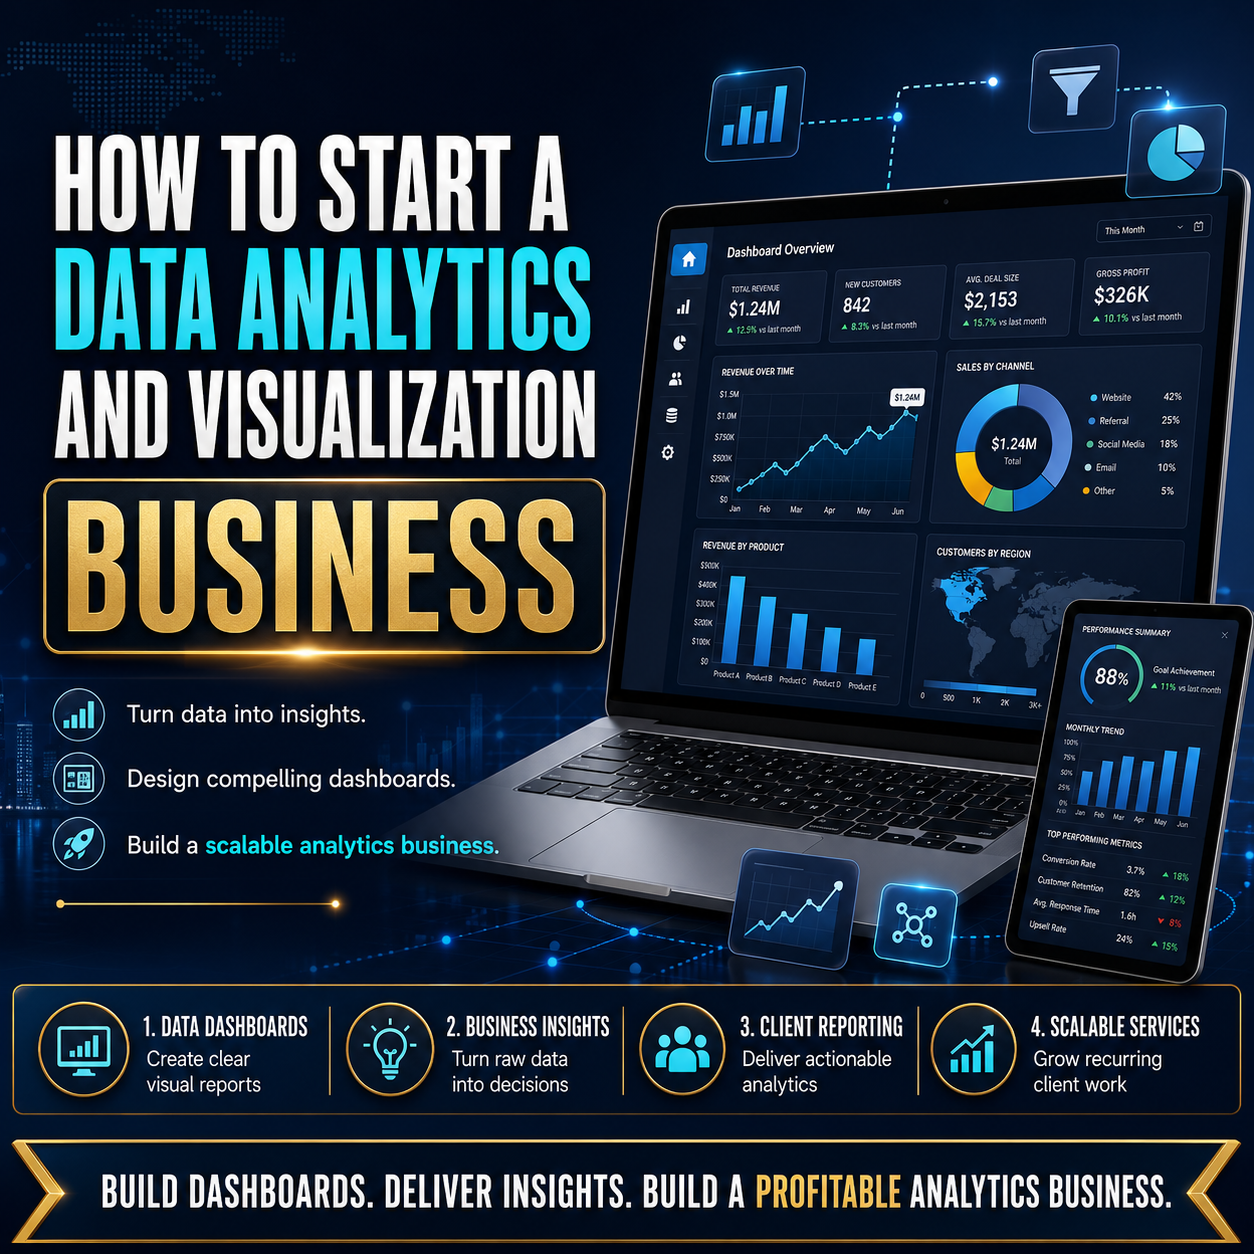
How to Start a Data Analytics and Visualization Business
Course Overview
Turn specialist knowledge into a clear, commercially focused offer with a practical route from idea validation to first customers.
You will learn how to turn operational data into useful dashboards, define measurable outcomes, choose a technology stack, price analytics engagements, and secure long-term reporting contracts.
This practical course shows you how to turn expertise in business intelligence, dashboards, operational analytics, and data visualisation into a market-ready analytics consulting business serving organisations that need clearer insight from operational and production data.
This course is designed to bridge the gap between technical capability and commercial execution. You will work through the decisions that determine whether a new venture is understandable to customers, realistic to deliver, and worth testing in the market.
Why This Course Matters
Technical expertise is only one part of building a sustainable analytics consulting business. You also need to identify a genuine customer problem, choose a focused market, define what you will deliver, establish credible pricing, manage delivery risk, and show prospective buyers why your offer is worth considering.
This course brings those decisions together in a structured framework. It helps you test assumptions before committing significant time or capital, develop a more credible market proposition, and approach early customer conversations with greater clarity and confidence.
Learning Outcomes
By the end of this course, you should be able to:
- Define a focused analytics consulting business proposition around business intelligence, dashboards, operational analytics, and data visualisation and connect it to clearly defined customer problems.
- Validate demand, choose a commercially relevant niche, and build an evidence-based profile of the customers most likely to value the offer.
- Package the product or service, clarify scope and deliverables, and identify the tools, technology, suppliers, partners, or operational capabilities required for delivery.
- Develop initial pricing, budget assumptions, contract considerations, quality controls, and delivery processes that support reliable customer outcomes and sustainable margins.
- Build a credible pilot, portfolio, or proof of concept and use it to approach organisations that need clearer insight from operational and production data.
- Create a practical route to market covering lead generation, sales conversations, launch activity, customer support, referrals, and appropriate recurring-revenue opportunities.
Who This Is For
- Engineers and technical professionals who want to commercialise expertise in Data analytics, Data visualization, Business intelligence, Dashboard development.
- Consultants and freelancers who want to turn specialist capability into a more clearly packaged and repeatable offer.
- Product builders and aspiring founders who need a structured method for validating demand before investing further.
- Professionals considering a transition from employment or project work into an independent technical business.
- Existing small-business owners who want to sharpen positioning, pricing, delivery, or customer acquisition in this specialist market.
Course Outcome
By the end of the course, you will have a focused business concept, a defined customer profile, a clearer value proposition, a packaged offer, an initial pricing and delivery model, and a step-by-step plan for testing the market and pursuing your first customers.
You will also have a practical framework for deciding what to validate first, where to concentrate limited resources, and how to present your capability with greater commercial credibility.
Enrol if you want to move from a technical idea to a structured, customer-focused launch plan grounded in the realities of analytics consulting business.
Related Topics
how to start a data analytics business, Data analytics, data analytics consulting business, Data visualization, data visualization services business, Business intelligence, Dashboard development, Reporting automation, Data storytelling, Analytics consulting, Decision support, Business development, Pricing strategy, Customer acquisition, Recurring revenue